View Tab

- Double click the view tab to maximize the view full screen. Double click it again to restore.
- Right mouse click on the view tab to open the view popup menu.
- Click

- in the view tab to close the Trend/Resistance/Support view.
- Left mouse click the view tab and hold down the mouse button to move the Trend/Resistance/Support view. Release the mouse button to place it.
View Toolbar
The View Toolbar contains controls and settings specific to the Trend/Resistance/Support view. Mouse hover over a button to see its tooltip.
Table to Spreadsheet button
- Click

- to export the Trend/Resistance/Support table to a spreadsheet (sorting applied prior to exporting will be preserved in the spreadsheet).
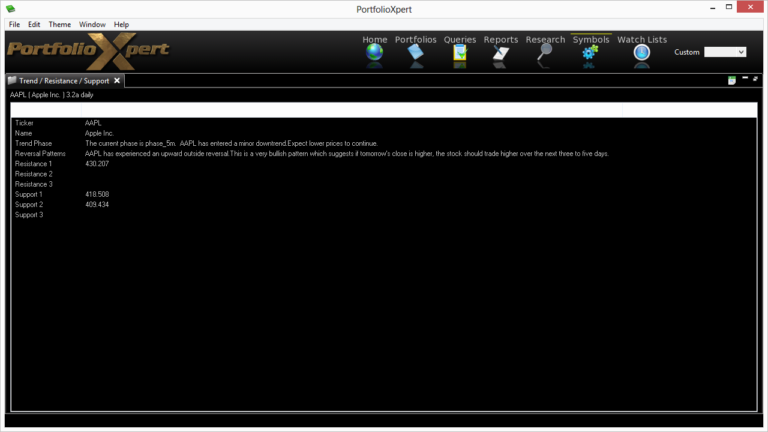
Information Displayed
- Ticker – security ticker symbol
- Name – security name
- Trend Phase – summary of the trading system/model’s current view of the security and expectation going forward (phases are numbered 1 thru 5)
- Reversal Patterns – summary of the reversal patterns experienced by the security (if applicable)
- Resistance 1 – first expected resistance price based on some technical and quantitative indicators (depending on the current trend one or more resistance prices could be absent)
- Resistance 2 – second expected resistance price based on some technical and quantitative indicators (depending on the current trend one or more resistance prices could be absent)
- Resistance 3 – third expected resistance price based on some technical and quantitative indicators (depending on the current trend one or more resistance prices could be absent)
- Support 1 – first expected support price based on some technical and quantitative indicators (depending on the current trend one or more support prices could be absent)
- Support 2 – second expected support price based on some technical and quantitative indicators (depending on the current trend one or more support prices could be absent)
- Support 3 – third expected support price based on some technical and quantitative indicators (depending on the current trend one or more support prices could be absent)